Scriptable Remote Debugging with Windbg and IDA Pro
June 7, 2018

Research by: Ben Herzog
(Updated February 2025; verified to work with IDA Professional 9)
Required Background:
The Problem Statement — Dynamic, Granular, Safe: Pick Two
There is no royal road to malware analysis. It’s a skill built on intuition, a healthy workflow and an ability to pick the right tool for the job. Disassemblers offer a graph view, type propagation, decompilation engines and definitive answers; debuggers don’t, but they are the sane way to tackle questions like “which std::String method am I looking at”. That’s just one example — there are many questions about code that, in practice, can only be answered by running the code. I like to call these problems “Breakpoint-Hard” (in the same vein as NP-hard).
If the debugger is your tool of choice already, these problems shouldn’t bother you too much. But if you’re like me, and you like your disassembler features, Breakpoint-Hard problems are a special kind of frustrating. One way of tackling them is throwing the malware in a sandbox (such as Cuckoo Sandbox) and seeing what comes out the other side, but a sandbox analysis is typically a blunt instrument. You are interested in a certain execution artifact; execution might not reach the relevant branch, or the sandbox might not see the artifact as important enough to record. In both cases, you have little choice but to sigh and fire up the debugger.
But then you run into one final annoying trade-off. Debugging malware also involves running malware, and it is not a good idea to run malware on a machine that you actually use for anything else (including malware analysis). The malware, and the debugger, therefore go in a Virtual Machine or some such. Debugging without all your hard-earned labels feels like a waste, and conversely, the realizations you reach while debugging don’t magically record themselves in your disassembly database; it’s up to you to take care of that. At best, you are constantly switching attention back and forth from your clean environment to your infected environment, transferring information manually from here to there and back again using this-or-that workaround. At worst, you are just winging it. Reverse engineering is difficult enough already without all this additional overhead.
The Remote WinDbg Solution (But First, a Word about Labeless)
This problem has not escaped analysts, and there are various attempted solutions to it already floating out there on the internet. One such solution, popular in my research group, is the Labeless plugin for IDA pro by Aliaksandr Trafimchuk, which integrates the IDA disassembler with a remote Virtual Machine running OllyDbg. Labeless’s target audience is people who swear by OllyDbg and the IDA/Olly split screen work flow.
If you’ve read this far, we can assume you do have the problem outlined in the previous section. So, if you are married to your Olly setup, you got queasy seeing WinDbg in the post title and you feel at home with the split screen, absolutely go check out Labeless, as it will be a better fit for your workflow. On the other hand, if you don’t care that much for Olly, you like the idea of access to IDA’s amenities while debugging, and you’d rather do all your static and dynamic RE work from one integrated application that uniformly speaks Python, you should consider setting up a Remote WinDbg environment.
The Remote WinDbg setup is comprised of two machines: The Manager and the Sandbox. The Sandbox is running a WinDbg debugger stub server, which can accept commands such as “please start debugging calc.exe“, “Please perform a step-into for this debugged process”, and so on. The sandbox can get infected with malware, and should not have access to any of your important files or data (even through a network share). The manager is your “clean” machine: it contains a copy of IDA Pro, which ships with native support that binds the IDA debugging API to the remote debugging server.
Once the environment is set up, you should be able to use the Manager for debugging malware, having an experience identical to what you would get if you had recklessly just executed the malware using IDA’s local debugger, while the malware is actually safely running away in the sandbox.
How to Set Up a Remote WinDbg Environment
You will need:
Setting up the Sandbox
C:\Program Files (x86)\Windows Kits\10\Debuggers). Navigate to that directory in the terminal window.cd x86 and then dbgsrv -t tcp:port=5032,server=localhostcd x64 and then dbgsrv -t tcp:port=5064,server=localhost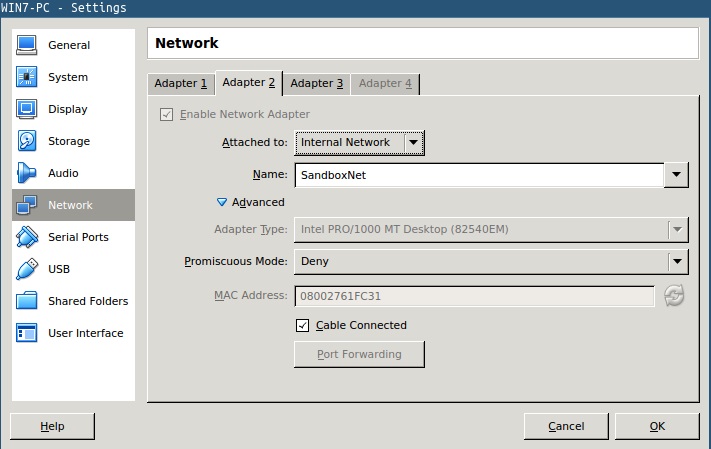
Figure 1: Configuring the internal network in VirtualBox for the case where the Manager is also a VM.
Setting up the Manager
cfg/ida.cfg, edit the file (this may require administrator privileges), uncomment the line that goes DBGTOOLS = ... and make sure it points to the correct location of your installed debugging tools. (e.g. DBGTOOLS = "C:\\Program Files (x86)\\Windows Kits\\10\\Debuggers\\x64";)pscp.exe in the installation directory.config.py, sandbox.py and windbg_remote.py) from the Github Repo to a directory of your choosing. Change the in-line configuration in config.py to suit the parameters of the Sandbox machine, including its IP address (in the internal debugging network), the SSH credentials and so on.C:\Symbols. Right click My Computer -> Properties -> Advanced System Settings -> Environment Variables (the exact path may vary depending on your Windows version). In the resulting screen click New... (if the dialogue has two “new” buttons, choose the one under “System Variables”). In the dialogue that appears, choose Variable Name to be _NT_SYMBOL_PATH and set Variable Value to be srv*c:\symbols*http://msdl.microsoft.com/download/symbols.Debugging -> Process options and set Connection String to tcp:port=5064,server={IP_ADDR} where {IP_ADDR} is the IP address of the Sandbox. Check the “Save network settings as default” checkbox, click OK and ignore the resulting errors (these happen because IDA attempts to start a debugging session right there and then — for some reason you cannot set your default network settings without doing this). The 64-bit server empirically works fine for both 32-bit and 64-bit debugees, but if you want to use the 32-bit server explicitly for some reason (e.g. you are using an old version of IDA that has a dedicated binary for analyzing 32-bit binaries, and setting up specific options for it), use tcp:port=5032 instead.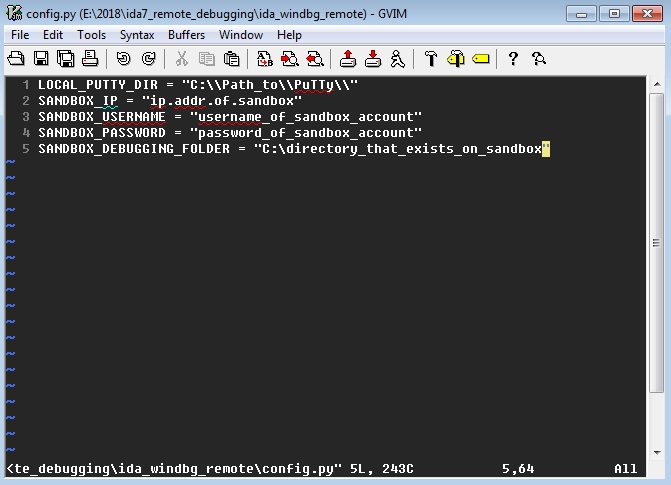
To see that your setup works, try to remote debug your 32-bit calc.exe executable.
File -> Open... and select the file C:\Windows\SysWOW64\calc.exe. (Unless your manager is running Windows 10. In that case, calc is a UWP application, and won’t necessary play well with your sandbox — so pick something else which you’re sure is a vanilla win32 application.)calc.exe due to permission issues, pick a directory of your choosing that you have write access to (My Documents will do).Debugger -> Debugger Options and check Suspend on debugging start.File -> Script file... and choose the script windbg_remote.py.remote_debug() and press Enter.If after some CPU crunching you are greeted by something like the below image — congratulations! You are now all set to remote debug with IDA! During this session of IDA, whenever you’re in static analysis mode, press F9 to start remote debugging. For new sessions of IDA, just open windbg_remote.py again as above and run remote_debug() again to get to the same point.
Take a Virtual Machine snapshot of your Sandbox, so you can easily revert to the clean snapshot after running malware.
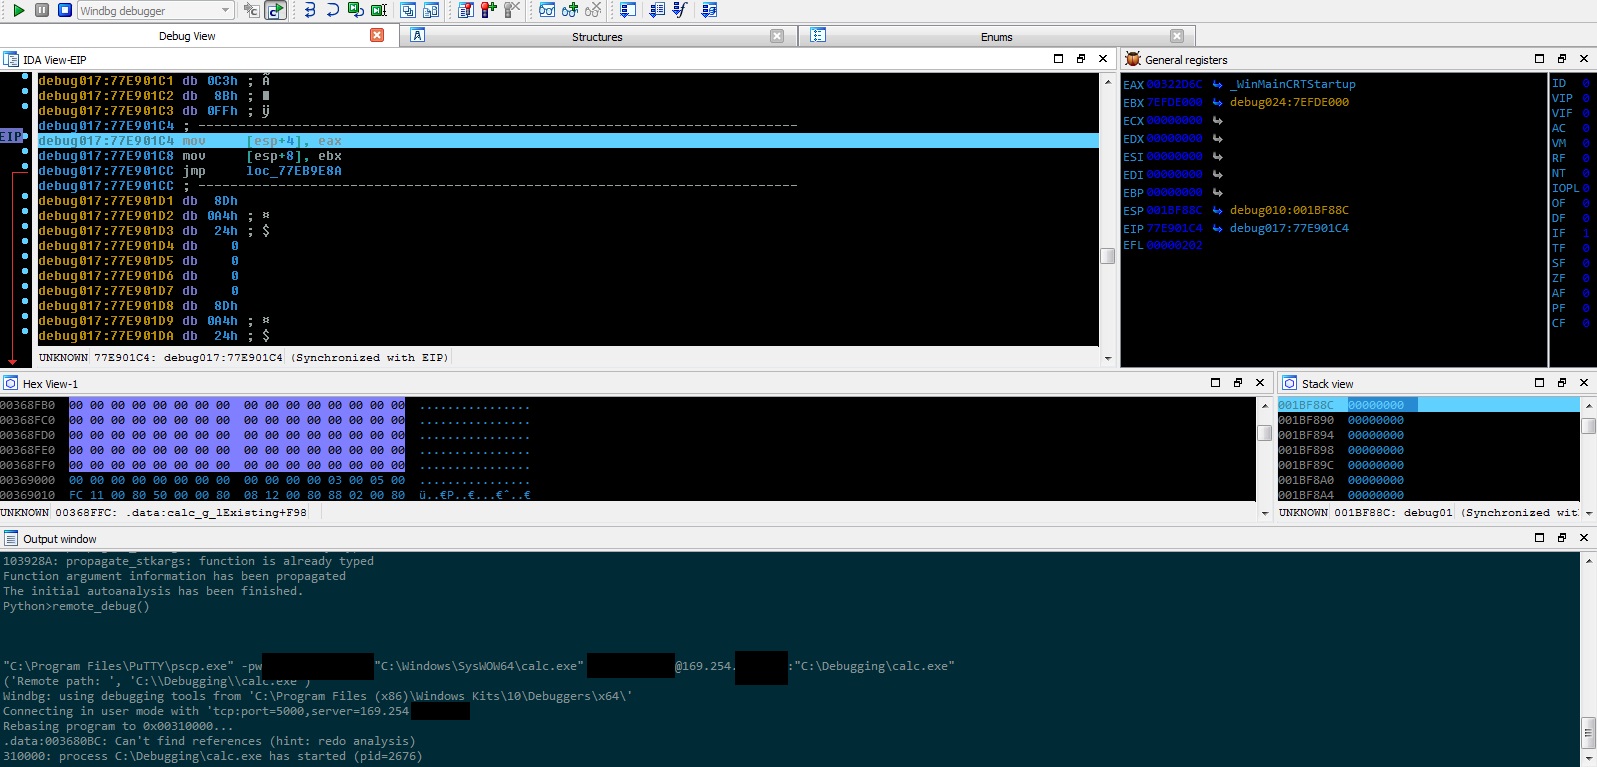
Figure 3: Remote debugging session in progress.
Troubleshooting
The above setup has many moving parts, and it would be surprising if you could get it to work without running into some trouble. While the above instructions were written after repeated testing using different environments, operating systems and situations, you may end up having to sort out some issues to get this ball of glue to function.
“Could not initialize WinDbg Engine”
IDA is failing to interface with your installed debugging tools. Edit the text file IDA_DIR/cfg/ida.cfg and set the variable DBGTOOLS to the correct directory manually. (e.g. DBGTOOLS = "C:\\Program Files (x86)\\Windows Kits\\10\\Debuggers\\x64";). Note that you need to restart IDA for changes to ida.cfg to take effect.
On newer versions of IDA, this issue is known to sometimes generate the cryptic message “Connect failed: the server is currently disabled”. If you are getting that message, try the fix above.
IDA says that the file I am trying to debug / the directory doesn’t exist
Chances are that the SCP transfer of the file being debugged is not going through. Verify that the remote directory you set in config.py actually exists in the Sandbox. Double check your connection string to make sure that IDA is actually looking for the file in the Sandbox instead of locally (in the Manager). Try a simple SCP from the Manager to the Sandbox; if it fails, you have a network problem you need to debug first. If it succeeds, double-check the rest of the parameters in config.py, as these are used to construct the scp command executed during a remote_debug().
“The version of OLE on the client and server machines does not match”
Trying to use a Windows XP machine as the Sandbox is known to cause this issue. If this is the case, probably the least painful way to solve your issue is to create the Sandbox from scratch with an OS of Windows 7 or later.
“%1 is not a valid win32 application”
The application you’re trying to debug may be a mismatch for your sandbox setup. To wit, the easiest way to get hit with this error is to set up a manager running Windows 10 and trying to debug your calc executable, which is a UWP application, on a sandbox running an earlier version of Windows. To make sure this isn’t your issue, copy the executable you are trying to debug to your sandbox, manually execute it there, and verify that it actually runs. If it doesn’t, you’ve found your issue – and you should try debugging a different executable, or using a more appropriate sandbox setup.
This issue also arises when IDA is trying to use debugging tools written for the wrong architecture. Make sure that the architecture named in the bottom-level directory of the DBGTOOLS path in IDA_DIR/cfg/ida.cfg matches the architecture of the IDA executable you are using. IDA version 7.0 and later is a 64-bit application; earlier versions are 32-bit applications (this goes both for the “IDA” and “IDA 64-bit” executables that ship with IDA; these refer to the architecture of the debugged executable, not to the architecture of the IDA executable). If you want to make absolutely sure, it’s fairly easy to directly verify the architecture of your IDA executable:
(32 bit) or by an asterisk (*) in older versions of windows. If the IDA Pro process has no such indicator, it is 64-bit.Note that you need to restart IDA for changes to ida.cfg to take effect.
“Failed to create process: The request is not supported”
This error is caused by trying to debug a 64-bit executable by connecting to a 32-bit debugging server. Check the TCP port in your connection string (in Debugger->Process Options) and double check that the version of the debugging server (dbgsrv.exe) listening on that port in the sandbox has the correct architecture. (A 32-bit debuggee will work with a 64-bit dbgsrv, but not the other way around.)
“pscp.exe returned non-zero exit status 1”
This issue arises when the original input file that was used to generate the database is no longer there, or has had its name changed. Since the exact SCP command that’s executed is echoed to the console along with this error message, you should be able to see where IDA is looking for the input file and just put a copy of it there. (If you’ve lost the input file, I’m afraid you have a problem on your hands.)
Example Use
One of the more useful benefits of using a setup such as this, rather than using a separate debugger and the disassembler, is that you can instantly and seamlessly make use of any IDA plugins that rely on IDA’s debugging API (as long as they rely on the same version of the API that your installation has). To demonstrate how this can work to your advantage, we will take a sample application and demonstrate the use of one such plugin — funcap.
According to the plugin’s author:
[funcap] records function calls (and returns) across an executable using IDA debugger API, along with all the arguments passed. It dumps the info to a text file, and also inserts it into IDA’s inline comments. This way, static analysis that usually follows the behavioral runtime analysis when analyzing malware, can be directly fed with runtime info such as decrypted strings returned in function’s arguments.
For this demonstration, we will use a sample executable that we have compiled from this Rust source code:
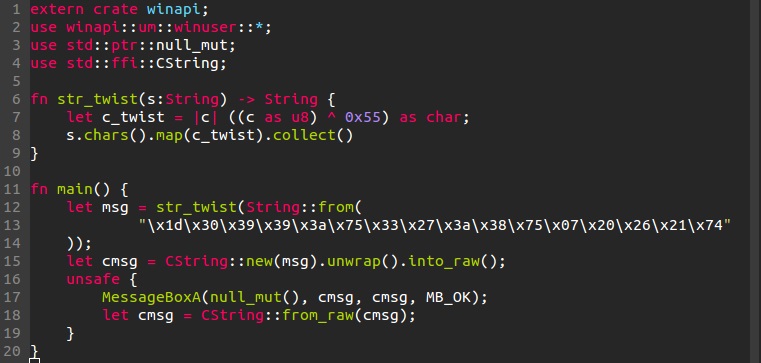
Figure 4: Source of our sample executable.
Granted — for this simple example, it’s possible to statically reverse-engineer what the executable prints, or to use a debugger. But, as we’ve explained in the introduction, static reverse-engineering will not be cost-effective for more complicated functions, and using a debugger will either not be safe or not seamlessly integrate with your static workflow. Using funcap with remote debugging, we will hopefully skirt around all these obstacles, seamlessly, even if this single function is replaced with 13 unidentified hash functions. Let’s open the executable in IDA and find the call to MessageBoxA:
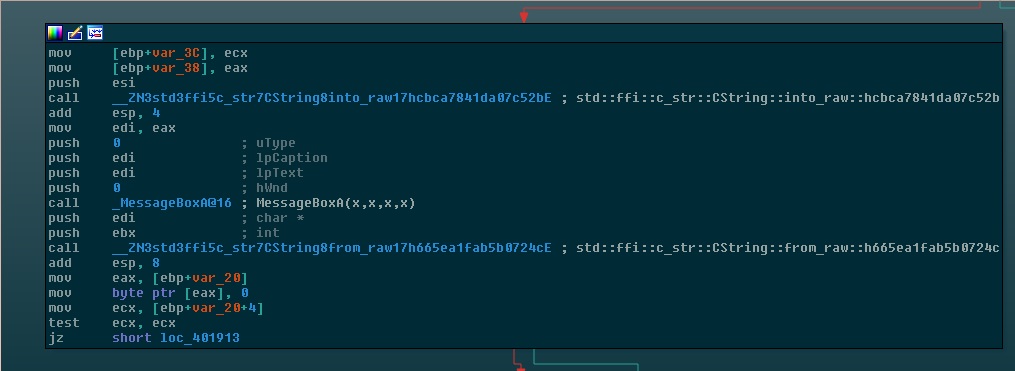
Figure 5: Call to MessageBoxA inside sample executable.
The way funcap works is that you run the script, and from that point on funcap is working in the background. As long as funcap is running, when execution hits a breakpoint that coincides with a call instruction, instead of pausing as normal, IDA records the parameters passed to the function and uses them to annotate the database.
Perform the following steps:
File->Script File... (in some versions of IDA, alt+f7) and choose the funcap script.File->Script File... again and this time choose the windbg_remote script.MessageBoxA (keyboard shortcut: f2).remote_debug() and press enter.If all has gone well, your disassembly should look like this now:
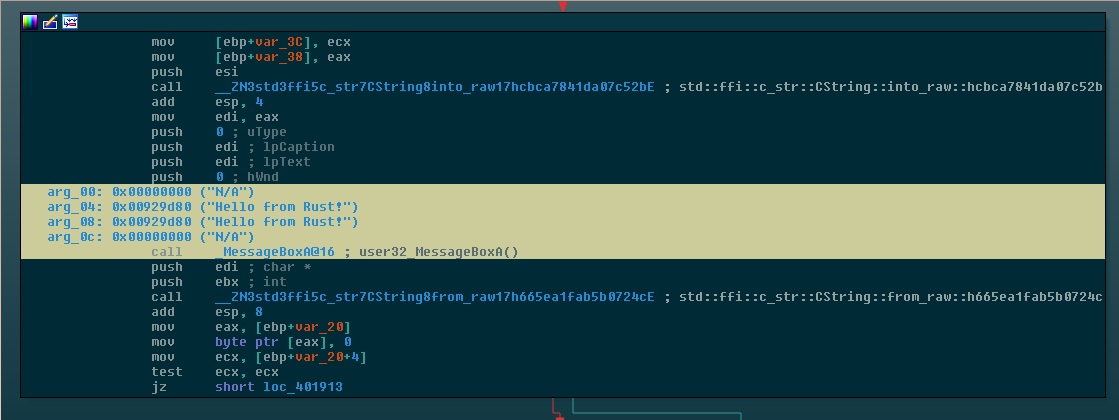
Figure 6: Call to MessageBoxA, after being annotated by funcap
And hopefully, from now on your breakpoint-hard problems will become breakpoint-easier.
Addendum: Yes, You Still Have Your ‘Revert to Snapshot’
While this setup has many advantages, it immediately introduces a certain regression to your workflow — the loss of the ‘revert-to-snapshot’ idiom. Thankfully, this loss can be fully mitigated.
Usually when working directly with a debugger, you can take a snapshot of your infected VM, with the debugged process caught at some stage of execution. Later, you can revert to this snapshot if you want to perform the execution from the same point again.
This isn’t an ability you want to lose. For instance, if you try using the above setup on some malware that unpacks itself into an arbitrary OS-chosen address on the heap, and you try to attack the problem without a usable post-unpack snapshot, your IDB is going to have a Very Bad Time.
Now, if you try to replicate this workflow as-is into the IDA+WinDbg setup described above, you will probably get some infuriating error message instead of the functionality you expected. Fortunately, you can obtain equivalent functionality in the remote IDA+WinDbg setup by performing the following steps.
Instead of a vanilla ‘take snapshot’:
windbg. You are now issuing windbg commands to the debugee (you may want to choose ‘Python’ again after step 4 is done).~*n into that console and press Enter. (This suspends all running threads in the debugged process.)Debugger -> Detach from process. IDA should hiccup and switch into static view.Instead of a vanilla ‘revert to snapshot’:
Debugger -> Attach to process. You should see a list the sandbox’s running processes. Pick the process you were originally debugging when you took the suspended snapshot. IDA should hiccup and switch into debugging view.~*m into the console and press Enter. (This un-suspends all threads in the debugged process that were not originally suspended when we issued ~*n).